BehaviourComposer: ignore everything before this. The BehaviourSpace is a NetLogo tool that allows you to systematically and comprehensively explore the parameter space of your model. This tutorial was designed be run after one has run the tutorial for creating a model of an epidemic on a social network.
Download model
First create a model where: - The Constant Network behaviour is activated (and the Power law network behaviours is deactivated).
- The Vaccinate random proportion of the population behaviour is activated and the Vaccinate most highly connected individuals is deactivated
- Send the model to NetLogo
Configure BehaviorSpaceNow you can tell the BehaviourSpace to run a series of experiments and output the data so that you can explore it with a spreadsheet. - In NetLogo go to Tools - BehaviorSpace
- Press the New button to create a new experiment
- Give your experiment a meaningful name
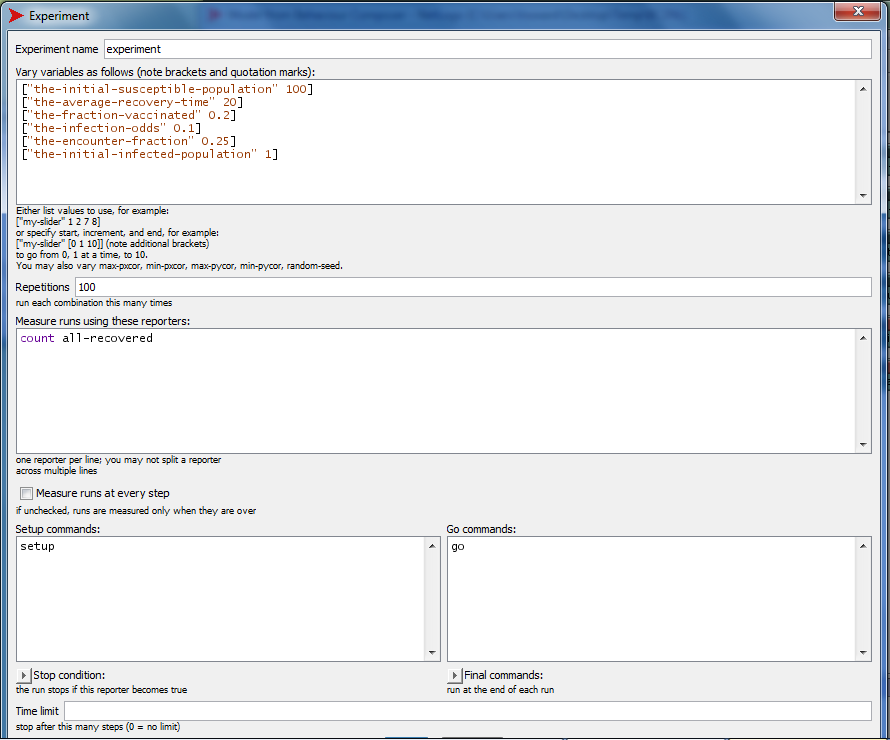
- Leave the variable settings as they are for now:
["the-infection-odds" 0.1]
["the-encounter-fraction" 0.25]
["the-fraction-vaccinated" 0.2]
["the-initial-susceptible-population" 100]
["the-average-recovery-time" 20]
["the-initial-infected-population" 1]
- Set number of repetitions to 100 to run the experiment 100 times
- Type
count all-recovered into the box for 'measure runs using these reporters'. (This tells the BehaviorSpace to record values for each run for this parameter. (count all-recovered reports the count of all the individuals that got infected and then recovered in your model). - Untick the box 'Measure runs at each step' to reduce the amount of data that is recorded
You should have a dialogue box as below (click image to see in more detail): - Press the OK button
- Run this experiment (press Run button)
- Choose 'Table Output' as the format for the data that the Behaviour Composer will record
- Select a file location on your computer where the results file will download to and give the file a name
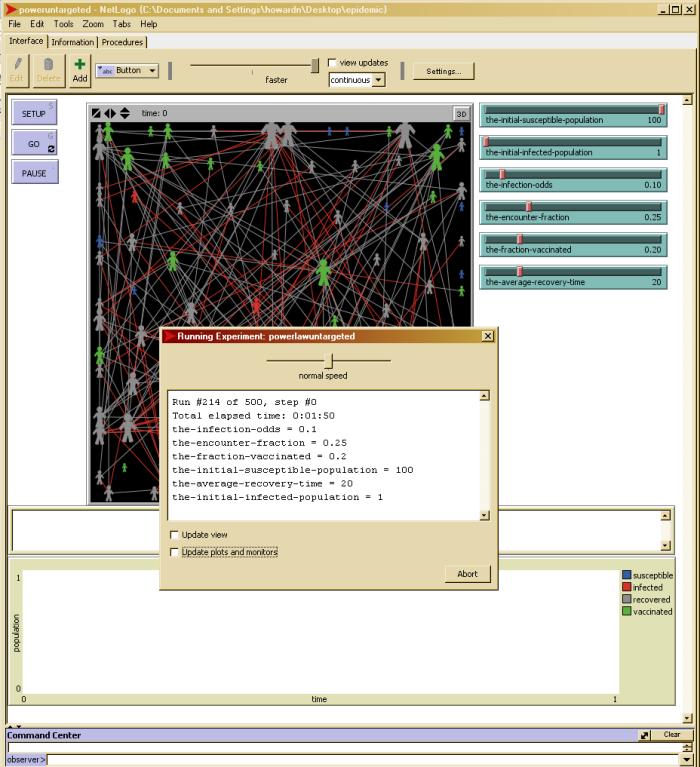
- Watch the experiment running for a bit then untick the boxes 'Update View' and 'Update plots and monitors' to speed things up

- Go back to the Behaviour Composer and repeat this process for the other network and vaccination strategy i.e. until you have data for
- Constant + random vaccination
- Power law + random vaccination
- Power law + targeted vaccination
Explore the data- Use a spreadsheet program (e.g. Google Docs or Microsoft Excel) or R to analyze the data file you just created using the Behaviour Space!
Note: You might like to plot a graph like below e.g. use the 'FREQUENCY' function (with ranges e.g. 0-4, 5-9,10,14 etc.) to count the number of recovered individuals for each run of the model. You will then see how often an epidemic spreads for the different social networks and vaccination strategies. If you make something let us know and we'll post your graphics below!
Sample graphsThe graphs below show similar results (3000 runs): BehaviourComposer: ignore everything after this. |
|

